Contents
Anthropometry Domain
IntroductionSubjective methods- Introduction to Subjective Methods
- Birth weight
- Body shape
- Weight and height
- Waist and hip circumference
- Introduction to Objective Methods
- Simple measures - stature
- Simple measures - weight
- Simple measures - circumference
- Simple measures - arm anthropometry
- Simple measures - skinfolds
- Simple measures - abdominal sagittal diameter
- Simple measures - head circumference
- Bioelectric impedance analysis
- Multi-component models
- Hydrostatic underwater weighing
- Air displacement plethysmography
- Hydrometry
- Whole body DEXA scan
- Near infrared interactance
- Whole body counting of total body potassium
- 3d photonic scan
- Magnetic resonance imaging (MRI) / Magnetic resonance spectroscopy (MRS)
- Total body electrical conductivity (TOBEC)
- Computed tomography (CT)
- Ultrasonography
- Introduction anthropometric indices
- Body mass index
- Fat and fat free mass indices
- Ponderal index
- Percentiles and Z-scores
- Anthropometry Video Resources
- Height procedure
- Protocol for measuring waist circumference
- Measuring hip circumference
- Weight and body composition procedure
Simple measures - skinfolds
The skinfold method, the measurement of subcutaneous fat folds, is the most widely adopted field method for the assessment of body fat, especially in children.
It is based on the principle that fat is of a known density and by “summing” measurements of subcutaneous fat thickness across the body, total and regional fat can be estimated.
Skinfold thickness measurements are typically used to rank individuals in terms of relative total “fatness”, or to assess subcutaneous fat at various regions of the body.
Population specific equations are used to derive estimates of percent body fat.
In infancy, it might be the sole tool available for assessing body composition longitudinally as other methods may not be feasible, or may only be suitable for use at body sizes e.g. PEA POD, can only measure infants up to 10kg.
The skinfold method involves measuring the skinfold (subcutaneous fat) thickness at specific sites of the body using a skinfold caliper and a non-stretchable measuring tape to correctly locate the measurement area.
Equipment
Caliper
The cost of calipers ranges from £9 to approximately £300. For research purposes, calipers with a more refined scale (e.g. 0.1 mm intervals) and constant pressure of 10 g/cm3 between the jaws are desirable. Examples include the Holtain (see Figure 1), Lange and Harpenden calipers (see instrument library for more details). The Lange and Harpenden calipers have been used in developing prediction equations and reference values (Lee 1996 [20]). The Lange is most popular in the US, and the Harpenden and Holtain in Europe.

Figure 1 Example of skinfold caliper typically used in children and infants.
Source: https://holtain.co.uk/tw.php
Measuring tape
Typically a non-stretch fibreglass or plastic measuring tape (such as those used in circumference measurements) is used to locate the anatomical midpoints on the body where the skinfold measurement is taken.
Protocol
Skinfold measurement can be obtained from 2 to 9 different standard anatomical sites around the body using a caliper, as shown in Figure 2. The subscapular and triceps skinfolds are the most commonly used.

Figure 2 Anatomical sites for skinfold thickness measurement taken at the left side.
Source: MRC Epidemiology Unit.
The following are the nine anatomical sites (as illustrated in Figure 2) that are most commonly used in the assessment of skinfold thickness:
- Chest or pectoral skinfold: For men, get a diagonal fold half way between the armpit and the nipple. In women, a diagonal fold 1/3 of the way from the arm pit to the nipple.
- Mid-Axillary: A vertical fold on the mid-axillary line which runs directly down from the centre of the armpit.
- Supra-iliac or flank: A diagonal fold just above the front forward protrusion of the hip bone (just above the iliac crest at the midaxillary line).
- Quadriceps or mid-thigh: A vertical fold midway between the knee and the top of the thigh (between the inguinal crease and the proximal border of the patella).
- Abdominal: A horizontal fold about 3 cm to the side of the midpoint of the umbilicus and 1 cm below it.
- Triceps: A vertical fold midway between the acromion process and the olecranon process (elbow).
- Biceps: A vertical pinch mid-biceps at the same level the triceps skinfold was taken.
- Subscapular: A diagonal fold just below the inferior angle of the scapula.
- Medial calf: The foot is placed flat on an elevated surface with the knee flexed at a 90° angle. A vertical fold taken at the widest point of the calf at the medial (inner) aspect of the calf.
- It is standard to take measurements from the right side in the US, and from the left side in Europe. When selecting the side it is important to be consistent.
- The site to be measured is marked once identified.
- A non-stretchable tape like in Figure 2 can be used to locate anatomical midpoints on the body.
- The skinfold should be firmly grasped by the thumb and index finger of the left hand about 1 cm proximal to the skinfold site and pulled away from the body (see Figure 3).
- The caliper is in the right hand (perpendicular to the axis of the skinfold and with dial facing up).
- The caliper tip should be 1 cm distal from the fingers holding the skinfold.
- The dial is read approx. 4 seconds after the pressure from the measurer’s hand has been released on the lever arm of the caliper.
- Measurement is recorded to the nearest 0.2 mm.
- Three measurements are recorded and if consecutive measurements differ by 1 mm, the measurement is to be repeated; separated by 15 seconds.
- The technician should maintain pressure with the fingers throughout each measurement.
- Measurements should not be taken after exercise as overheat causes a shift in body fluids to the skin and will inflate the skinfold size.
- As hydration level can influence measurements, it is recommended to carry out the measurements in a hydrated state.

Figure 3 Quadriceps skinfold thickness in an infant to the left and triceps skinfold thickness in an adult to the right.
Source: MRC Epidemiology Unit.
An example of a calibration block with known thicknesses Figure 4 is used to calibrate skinfold calipers. Typically, calibrations are carried out on a monthly basis.

Figure 4 An example of a calibration block.
Source: MRC Epidemiology Unit.
- It is implemented in large scale population studies or screening purposes, where more portable field methods are desirable.
- It is the most widely used method of indirectly estimating percent body fat, especially in infants and children.
Skinfold thickness are typically recorded in mm. Some calipers record in both mm and cm. The skinfold thickness values should be quality checked during data processing in the same manner as other health related variables, for example by checking for outliers and data entry errors.
Raw skinfold thickness values are often used and they act as reliable indicators of regional fatness. In a similar way to body mass index (BMI), they can be converted into standard deviation scores (SDS) for longitudinal evaluations.
The triceps site is the most commonly used single-site skinfold measurement as it is easy to measure and reference data (e.g. WHO triceps skinfold thickness for age) are available for comparison. However, no equations are available for estimating body fat from a single-site skinfold measurement. Triceps measurement is also used to derive indices of body composition using arm anthropometry.
To convert raw skinfold thickness values into a percent of body fat, population-specific or generalised equations are used. These equations are derived from empirical relationships between skinfold thickness and body density. Many equations firstly calculate body density and require an additional calculation to estimate percent body fat. The Brozek et al (1963) and the Siri (1961) equations can be used for this step:
- Brozek: % body fat = (457-body density) - 414
- Siri = % body fat = (495/body density) - 450
Body fat values should be generated from published equations which closely match the study population. It is critical that the equation selected for estimating body fat is appropriate to the demographics of the cohort under investigation (e.g. race, age, and gender).
Several equations are available. The most commonly used equations are listed below:
Adults
Jackson & Pollock (1985)
- Men 4-Site Skinfold Equation (for calculating % body fat)
% Body Fat = (0.29288 * sum of skinfolds) – (0.0005 * square of the sum of skinfolds) + (0.15845 * age) – 5.76377, where the skinfold sites (mm) are abdominal, triceps, thigh and supra-iliac
- Women 4-Site Skinfold Equation (for calculating % body fat)
% Body Fat = (0.29669 * sum of skinfolds) – (0.00043 * square of the sum of skinfolds) + (0.02963 * age) + 1.4072, where the skinfold sites (mm) are abdominal, triceps, thigh and supra-iliac
- Women 3-Site Skinfold Equation
% Body Fat = (0.41563 * sum of skinfolds) – (0.00112 * square of the sum of skinfolds) + (0.03661 * age) + 4.03653, where the skinfold sites (mm) are abdominal, triceps and supra-iliac
Durnin Womersley (1974)
Durnin Womersley (1974) developed general equations from a heterogeneous group of varying ages. The calculation of body fat % involves measuring 4 skinfold sites, triceps, biceps, subscapular and supra-iliac, and substituting the log of their sum into one of the following equations (Table 1), depending on the participant’s age and sex. The density value can then be converted to percent body fat (%BF) using Siri 1961 or Brozek 1963 equations described above.
Table 1 Durnin Womersley equations for the estimation of body density using 4 skinfold sites.
| Age (years) |
|
|
|---|---|---|
| < 17 |
|
|
| 17-19 |
|
|
| 20-29 |
|
|
| 30-39 |
|
|
| 40 -49 |
|
|
| > 50 |
|
|
D = predicted density of the body (g/ml), and L = log of the total of the 4 skinfolds (mm).
Source [14]
Estimates derived using these equations have been compared to those from the criterion 4-component model (see Figures 5 and 6). The Durnin and Wormersley (1974) equation showed significant mean difference/bias of -2%, while the Jackson and Pollock (1985) equation showed mean bias of -6.6%. Both equations tend to underestimate body fat especially in larger individuals. Similar results have also been observed in men (Peterson et al., 2003).
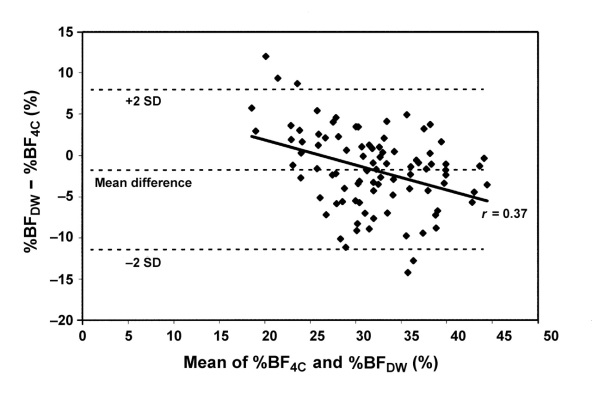
Figure 5 Bland-Altman plot showing the limits of agreement between percentage body fat calculated with the 4-compartment-model equation (%BF4C; the reference equation) and percentage body fat calculated with the Durnin and Wormersley
equation (%BF
DW) in women.
Source: Peterson et al. (2003).
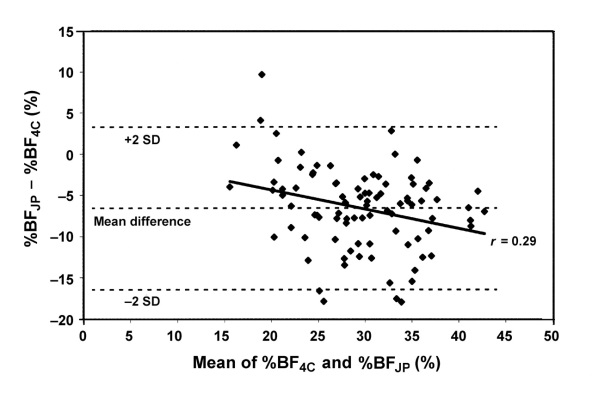
Figure 6 Bland-Altman plot showing the limits of agreement between percentage body fat calculated with the 4-compartment-model equation (%BF4C; the reference equation) and percentage body fat calculated with the Jackson and Pollock
equation (%BF
JP) in women.
Source: Peterson et al. (2003) [23].
Children and young adolescents
A priori, age- and sex-dependent regression equations published by Weststrate and Deurenberg (1989) that were derived from modification of the Siri (1961) equation (% fat = 495/density-450), are the most suitable for the estimation of % FM in children and adolescents:
- Girls: Fat (%) = [553 - 7.3 (Age - 10)] / D - [514 - 8 (Age - 10)]
- Boys: Fat (%) = [562 - 4.2 (Age - 2)] / D - [525 - 4.7 (Age - 2)]
However, Slaughter et al. (1988) equations proposed for pre-pubertal, pubertal and post-pubertal males and females are the most commonly used.
Table 2 lists equations used to determine body composition values in children and adolescents using skinfold measurement.
Table 2 Published equations used to estimate body fat in children and adolescents from skinfolds.
| Author(s) | Population | Equation(s) |
|---|---|---|
| Lohman et al. (1984) | Prepubescent children | M and F: Fat (%) = 530 / D − 489 |
|
Weststrate and Deurenberg (1989)
|
10−18 y (modification of Siri equation)
|
F: Fat (%) = [553−7.3 (Age−10)] / D − [514−8 (Age−10)] M: Fat (%) = [562−4.2 (Age−2)] / D − [525−4.7 (Age−2)] |
| Brook (1971) | 1−11 y (predicted from equations for adolescents) |
F: D = 1.2063−0.0999 (LOG sum of 4 skinfolds) M: D = 1.1690−0.0788 (LOG sum of 4 skinfolds) |
|
Durnin and Rahaman (1967); Durnin and Womersley (1974) |
13−15.9 y 16−19.9 y |
F (13−15.9 y): D = 1.1369−0.0598 (LOG sum of 4 skinfolds) M (13−15.9 y): D = 1.1533−0.0643 (LOG sum of 4 skinfolds) F (16−19.9 y): D = 1.1549−0.0678 (LOG sum of 4 skinfolds) M (16−19.9 y): D = 1.162−0.063 (LOG sum of 4 skinfolds) |
| Johnston et al. (1988) | 8−14 y |
F: D = 1.144−0.06 (LOG sum of 4 skinfolds) M: D = 1.166−0.07 (LOG sum of 4 skinfolds) |
| Deurenberg et al. (1990) |
Pubertal F: 13.1 ± 0.15 y Pubertal M: 13.8 ± 0.21 y Post-pubertal F: 16.8 ± 0.36 y Post-pubertal F: 17.5 ± 0.39 y |
F pubertal: D = 1.1074 − 0.0504 (LOG sum of 4 skinfolds) + 1.6 (age 10-3) M pubertal: D = 1.0555 − 0.0352 (LOG sum of 4 skinfolds) + 3.8 (age 10-3) F post-pubertal: D = 1.183 − 0.0813 (LOG sum of 4 skinfolds) M post-pubertal: D = 1.1324 − 0.0429 (LOG sum of 4 skinfolds) |
| Sarría et al. (1998) | 11−16.9 y |
M (11−13.9): D = 1.1516 − 0.0658 (LOG sum of 4 skinfolds) M (14−16.9): D = 1.169 − 0.0693 (LOG sum of 4 skinfolds) |
| Sloan et al. (1962) | Young women | F: D = 1.0764 − 0.00081 suprai − 0.00088 tric |
| Wilmore and Behnke (1970) | Young women | F: D = 1.06234 − 0.00068 subsc − 0.00039 tric − 0.00025 thigh |
| Slaughter et al. (1988) |
Prepubertal F: 10.0 ± 1.0 y Prepubertal M: 9.8 ± 1.3 y Pubertal F: 11.4 ± 1.9 y Pubertal M: 12.2 ± 1.4 y Post-pubertal F: 15.3 ± 1.6 y Post-pubertal M: 15.8 ± 1.6 y |
All F: Fat (%)= 1.33 (tric+subsc) − 0.013 (tric+subsc)2 − 2.5 Pre-pubertal M: Fat (%) =1.21 (tric+subsc) − 0.008 (tric+subsc)2 − 1.7 Pubertal M: Fat (%) = 1.21 (tric+subsc) − 0.008 (tric+subsc)2 − 3.4 Post-pubertal M: Fat (%)= 1.21 (tric+subsc) − 0.008 (tric+subsc)2 − 5.5 All F when (tric+subsc) > 35 mm: Fat (%) = 0.546 (tric+subsc) + 9.7 All M when (tric+subsc) > 35 mm: Fat (%) = 0.783 (tric+subsc) + 1.7 F: Fat (%)= 0.61 (tric+calf) +5.1 M: Fat (%)= 0.735 (tric+calf) + 1 |
| Lean et al. (1996) | 18−64.3 y |
F: Fat (%)= 0.730 BMI + 0.548 tric + 0.270 Age − 5.9 M: Fat (%)= 0.742 BMI + 0.95 tric + 0.335 Age − 20 |
| Bray et al. (2001) | 10y |
M and F: Fat (%)=7.66 + 0.22 subsc + 0.21 thigh + 0.64 biceps + 0.31 calf M and F: Fat (%)=8.71 + 0.19 subsc + 0.76 biceps + 0.18 suprai + 0.33 tric |
F: females, M: males, y: years, D: density (kg/l), BMI: body mass index (kg/m2), sum of 4 skinfolds: biceps + triceps+ subscapular + suprailiac (mm), age (years), tric: triceps skinfold (mm), biceps: biceps skinfold (mm), subsc: subscapular
skinfold (mm), suprai: suprailiac skinfold (mm), thigh: thigh skinfold (mm), calf: calf skinfold (mm).
Source: Rodriguez et al. (2005).
Some equations for children and adolescents have been compared with the criterion 4-component model, see Table 3. Significant bias for percentage body fat and fat free mass was observed for the equations by Slaughter et al. (1988), Johnston et al. (1988) and Brook (1971). No significant mean bias was shown by the equation by Deurenberg et al. (1990), but the bias was correlated significantly to fatness and limits of agreements were wide indicating that individual values are not accurate. This may affect the evaluation of body composition changes within individuals overtime.
Table 3 Bias and 95% limits of agreement for % body fat predicted using skinfold-thickness equations against measurements made with the 4-component model.
| Equation |
|
|
|
|---|---|---|---|
| Slaughter et al. (1988) |
|
|
|
| Percentage body fat (%) |
|
|
|
| Johnston et al. (1988) |
|
|
|
| Percentage body fat (%) |
|
|
|
| Deurenberg et al. (1990) |
|
|
|
| Percentage body fat (%) |
|
|
|
| Brook (1971) |
|
|
|
| Percentage body fat (%) |
|
|
|
1Bias was calculated as skinfold-thickness values minus values from use of the 4C model. Correlations were calculated as the correlation between the difference and mean. 95% limits of agreement calculated as ± 2SD of the difference between
techniques. FFM values were log transformed to express the difference as a percentage of the mean. Values for percentage body fat are expressed as a percentage of body weight.
2 P < 0.0001.
3 P < 0.005.
Adapted from: Wells et al. (1999).
Infancy
There are limited equations to use in infancy to derive % body fat and they tend to be population or age specific (e.g. first 10 days of life) and based on different skinfold thickness measuring sites.
- Dauncey et al. (1977) in the 4 months of life, based on 2 sites (subscapular and triceps), ethnicity not defined.
- Sen et al. (2010) in 6-24 months Indian infants based on 3 sites (biceps, triceps and suprailiac) plus arm circumference.
- Schmelzle et al. (2002) in 1-10 days old White German infants based on 4 sites (subscapular, biceps, triceps and suprailiac) However, the reference method used was DEXA which has not been directly validated in neonates for body composition assessment. DEXA validation studies in infancy are based on a piglet model.
- Deierlein et al. (2012) in 1-3 days old multi-ethnic population based on 4 sites (triceps, subscapular, flank, and thigh).
- Catalano et al. (1995) in 1-2 days old American infants of white, black and Hispanic ethnicities based on 1 site (flank). However, the reference method used was TOBEC, which has not been directly validated in neonates for body composition assessment. Cross-validation studies would be required to determine the accuracy of these equations in predicting % body fat in other neonates and infants populations.
- Aris et al. (2013) in 1-3 days old Asian infants, based on 1 site (subscapular).
The Deierlein et al. (2012), Catalano et al. (1995) and Aris et al. (2013) equations have been evaluated using air displacement plethysmography (PEABOD) at birth and 3 months, demonstrating significant bias for body fat in the equation by Catalano et al. (1995) at birth, and significant bias for body fat at 3 months for all the equations.
Table 4 Bias and 95% limits of agreement for % body fat predicted using skinfold-thickness equations against measurements made with the 4-component model.
| Equation |
|
|
|
|||||
|---|---|---|---|---|---|---|---|---|
|
|
|
|
|
|
|
|
|
|
| Birth |
|
|
|
|
|
|
|
|
| Deierlein |
|
|
|
|
|
|
|
|
| Catalano |
|
|
|
|
|
|
|
|
| Aris |
|
|
|
|
|
|
|
|
| 3 months |
|
|
|
|
|
|
|
|
| Deierlein |
|
|
|
|
|
|
|
|
| Catalano |
|
|
|
|
|
|
|
|
| Aris |
|
|
|
|
|
|
|
|
*Significance for the correlation of the strength for the relationship between the mean of the criterion and each equation correlated to the difference between the equations estimated infant fat mass and the criterion measured fat mass. A non-significant
correlation suggests no bias in the technique across the range of fatness.
Source: Clauble et al. (2016).
Equations derived in children have also been used to estimate % body fat in infancy, such as Deurenberg et al. (1989) and Slaughter et al. (1988). However, the relationship between total body density and skinfold thickness varies with age and those equations may not be applicable in younger groups.
Estimates derived using the Slaughter et al. (1988) equation have been compared to those from air displacement plethysmography (PEABOD) at 6 weeks and at 4.5 months of age, and to those from DEXA at 4 months. Agreement analysis showed significant bias at 6 weeks, underestimating percentage body fat by 2.4–8.9%. At 4.5 months, the underestimation was greater in infants with the highest body fat. The limits of agreement were wide; error ranged from 18% fat below to 9% fat above the PEA POD measurement. The agreement analysis between Slaughter et al. (1988) and DEXA shows a considerable systematic bias which increases with increasing % body fat. The equation overestimated % body fat by 10.7% when compared to the PEAPOD measurement (Lingwood et al., 2012; Schmelze et al., 2002).
Estimates derived from the Deurenberg et al. (1989) equation have been compared to those from DEXA at 4 months of age. The equation overestimated % body fat by 6.27% when compared to the DEXA measurement (Schmelze et al., 2002).
When analysing data in infancy, often the raw thickness data are used. The sum of the thicknesses is determined and internal standard deviation score (Z-score) are derived. Internal Z-scores can be generated by regressing skinfolds on age (and using the saved residuals), and then adjusting for sex in the analyses.
Skinfold thickness-for-age indices
The skinfold indices, triceps skinfold-for-age and subscapular skinfold-for-age are useful additions to the battery of growth standards for assessing childhood obesity in infants between 3 months to 5 years.
These indices are expressed in percentiles (percentage of median) and can be assessed by the percentile point achieved by a child relative to the healthy children of that age and gender in the same population. Median is regarded as a reference value, and 3rd and 97th percentiles as thresholds to indicate abnormally low or abnormally high values.
The indices can also be expressed as Z-score derived by using the formula:
(Measured value – Average value in the reference population) / Standard deviation of the reference population
The WHO growth standard for triceps skinfold-for-age and subscapular skinfold-for-age are used for interpretation.
An overview of skinfold thickness methods is outlined in Table 5.
Strengths
- Inexpensive
- Non-invasive
- Little space required
- Portable
- Simple to obtain in most age groups including infants
- Estimates of body composition from skinfolds correlates well with those derived from the reference methods, underwater weighing
- The use of a standardized protocol increases the reliability of skinfold thickness measurement
- Intra-observer and inter-observer errors are low compared to between‐individual variability
- Possibly the sole tool to assess body composition changes in infancy and in early childhood, where other methods like the PEAPOD are not feasible
- Skinfolds are particularly useful in monitoring changes in fatness in children because of their small body size, and the majority of fat is subcutaneous even in obese children
- Convenient and cost-effective means of monitoring changes in body composition of large groups over time
Limitations
- Accuracy dependent on the technician's skill as well as the type of caliper and the skinfold prediction equation used
- The reliability of the measurements decreases with increasing thickness
- Cheaper plastic calipers have a less precise measuring scale, and often provide variable pressure and a smaller range of measurement
- Accuracy and precision are poorer in obese individuals as it is difficult to hold a large skinfold while reading the caliper dial
- Most skinfold calipers have an upper measurement limit of 45 to 60 mm, which restricts their use to overweight and obese individuals.
- The majority of national reference data available are for skinfolds at the triceps and subscapular locations. The triceps skinfold varies considerably by sex and can reflect changes in the underlying triceps muscle rather than an actual change in body fatness.
- Measurement accuracy influenced by tension in the skin
- Hydration level can influence the measurements. Dehydration reduces the skinfold size. Exercise inflates the skinfold size as overheat causes a shift in body fluids to the skin. Oedema and dermatitis increase the skinfold size.
- Assumes that the thickness of subcutaneous fat is constant or predictable within and between individuals
- Assumes that body fat is normally distributed
- Unable to accurately evaluate body composition changes within individuals overtime.
- Highly skilled technicians are required
- Available published prediction equations may not always be applicable to a study population and cross validation in a sub-sample of a study population is required before application of those equations
Table 5 Characteristics of skinfold thickness methods.
| Consideration | Comment |
|---|---|
| Number of participants | Large |
| Relative cost | Low |
| Participant burden | Low |
| Researcher burden of data collection | Medium as method requires highly trained observers |
| Researcher burden of coding and data analysis | Low |
| Risk of reactivity bias | No |
| Risk of recall bias | No |
| Risk of social desirability bias | No |
| Risk of observer bias | Yes |
| Space required | Low |
| Availability | High |
| Suitability for field use | High |
| Participant literacy required | No |
| Cognitively demanding | No |
Considerations relating to the use of skinfold thickness methods in specific populations are described in Table 6.
Table 6 Use of skinfold thickness methods in different populations.
| Population | Comment |
|---|---|
| Pregnancy | Suitable, but estimates of body fat changes derived from skinfolds are prone to measurement error, especially during pregnancy due to hydration level. Rapid decreases in measurement occur postpartum that are likely attributable to changes in hydration following delivery rather than marked changes in subcutaneous fat |
| Infancy and lactation | Suitable |
| Toddlers and young children | Suitable |
| Adolescents | Suitable |
| Adults | Suitable |
| Older Adults | Suitable, but presence of oedema may affect estimates |
| Ethnic groups | Suitable |
| Other (obesity) | Suitable, but difficult to get reliable measurements, especially in those cases in which skinfold thickness approach the upper limit of the measurement range of the caliper |
To obtain reliable data from this method it is essential to standardize the procedure, train the participating staff and assess inter and intra observer reliability to monitor measurement error.
Refer to section: practical considerations for objective anthropometry
- Skinfold calipers
- Tape measure
- Marker pen to locate the measuring site
- Recording sheets
- Trained measurer
- Aris IM, Soh SE, Tint MT, Liang S, Chinnadurai A, Saw SM, et al. Body fat in Singaporean infants: development of body fat prediction equations in Asian newborns. European journal of clinical nutrition. 2013;67(9):922-7. Epub 2013/04/04
- Ackland TR, Lohman TG, Sundgot-Borgen J, Maughan RJ, Meyer NL, Stewart AD, Muller W: Current Status of Body Composition in Sport – Review and Position Statement on Behalf of the Ad Hoc Research Working Group on Body Composition Health and Performance, Under the Auspices of the I.O.C. Medical Commission Sports Med 2012: 42; 227
- Bray GA, Bouchard C. Handbook of Obesity: Volume 1: Epidemiology, Etiology, and Physiopathology. Number 3 ed: Taylor & Francis Ltd, CRC Press; 2013.
- Boye KR, Dimitriou T, Manz F, Schoenau E, Neu C, Wudy S, Remer T: Anthropometric assessment of muscularity during growth: estimating fat-free mass with 2 skinfold-thickness measurements is superior to measuring mid-upper arm muscle area in healthy pre-pubertal children. Am J Clin Nutr 2002: 76; 628
- Brozek, J., Grande, F., Anderson, J. T., & Keys, A. (1963). Densitometric analysis of body composition: Revision of some quantitative assumptions. Annals of the New York Academy of Sciences, 110, 113-140.
- Butte NF: Body composition during the first 2 years of life: An updated reference Pediatr Res 2000: 47; 578
- Catalano PM, Thomas AJ, Avallone DA, Amini SB. Anthropometric estimation of neonatal body composition. American journal of obstetrics and gynecology. 1995;173(4):1176-81. Epub 1995/10/01.
- Cauble JS, Dewi M, Hull HR. Validity of anthropometric equations to estimate infant fat mass at birth and in early infancy. BMC pediatrics. 2017;17(1):88. Epub 2017/03/30.
- Chambers AJ, Parise E, McCrory JL, Cham R: A comparison of prediction equations for the estimation of body fat percentage in non-obese and obese older Caucasian adults in the United States. J Nutr Health Ageing 2014: 18; 586
- Dauncey MJ, Gandy G, Gairdner D. Assessment of total body fat in infancy from skinfold thickness measurements. Archives of disease in childhood. 1977;52(3):223-7. Epub 1977/03/01.
- Davidson LE, Wang J, Thornton JC, Kaleem Z, Silva-Palacios F, Pierson RN, Heymsfiled SB, Gallagher D: Predicting Fat Percent by Skinfolds in Racial Groups: Durnin and Womersley Revisited. Med Sci Sports Exerc 2011: 43; 542
- Duren DL, Sherwood RJ, Czerwinski SA, Lee M, Choh AC, Siervogel RM, Chumlea WC: Body Composition Methods: Comparisons and Interpretations J Diab Sci Technol 2008: 2; 1139
- Deierlein AL, Thornton J, Hull H, Paley C, Gallagher D. An anthropometric model to estimate neonatal fat mass using air displacement plethysmography. Nutrition & metabolism. 2012;9:21. Epub 2012/03/23.
- Durnin JV, Womersley J: Body fat assessed from the total body density and its estimation from skinfold thickness: measurements on 481 men and women aged from 16 to 72 years. British Journal of Nutrition 1974: 32; 77
- Duren DL, Sherwood RJ, Czerwinski SA, Lee M, Choh AC, Siervogel RM, et al. Body composition methods: comparisons and interpretation. Journal of diabetes science and technology. 2008;2(6):1139-46. Epub 2009/11/04.
- Fomon SJ: Body composition of reference children from birth to age 10 years Am J Clin Nutr 1982: 35; 1169
- Freedman DS, Horlick M, Berenson GS: A comparison of the Slaughter skinfold-thickness equations and BMI in predicting body fatness and cardiovascular disease risk factor levels in children Am J Clin Nutr 2013: 98; 1417
- Heymsfield SB, Lohman TG, Wang Z, et al: Human body composition. 2nd ed. Human kinetics; Champaigh, IL: 2005
- Jackson A S, Pollock, M: Practical assessment of body composition. Physician Sport Med 1985: 13; 76
- Lee R, Nieman D. Nutritional Assessment: Mosby; 1996
- Lingwood BE, Storm van Leeuwen A, Carberry, AE, Fitzgerald EC, Callaway LK, Colditz PB, Ward LC. Prediction of fat-free mass and percentage of body fat in neonates using bioelectrical impedance analysis and anthropometric measures: validation against the PEA POD. British Jounal of Nutrition 2012: 107 (10); 1545
- Parrillo J, Greenwood-Robinson M: "High-performance bodybuilding" Berkeley Publishing group, New York,169-172, 1993
- Peterson MJ, Czerwinski SA, Siervogel RM. Development and validation of skinfold-thickness prediction equations with a 4-compartment model. The American journal of clinical nutrition. 2003;77(5):1186-91. Epub 2003/04/30.
- Reilly JJ, Wilson J, Durnin JV: Determination of body composition from skinfold thickness: a validation study. Archives of Disease in Childhood 1995; 73: 305
- Rodriguez G, Moreno LA, Blay MG, Blay VA, Fleta J, Sarria A, Bueno M, AVENA-Zaragoza Study Group: Body fat measurement in adolescents: comparison of skinfold thickness equations with dual-energy X-ray absorptiometry. Eur J Clin Nutr 2005: 59;1158
- Schmelzle HR, Fusch C. Body fat in neonates and young infants: validation of skinfold thickness versus dual-energy X-ray absorptiometry. Am J Clin Nutr. 2002;76(5):1096-100. Epub 2002/10/26.
- Siri, W. E. (1961). Body composition from fluid space and density. In J. Brozek & A. Hanschel (Eds.), Techniques for measuring body composition (pp. 223-244). Washington, DC: National Academy of Science
- Slaughter MH, Lohman TG, Boileau RA, Horswill CA, Stillman RJ, van Loan MD, Bemben DA: Skinfold equations for estimation of body fatness in children and youth. Human Biology 1988: 60; 709
- Sen B, Bose K, Shaikh S, Mahalanabis D. Prediction equations for body-fat percentage in Indian infants and young children using skinfold thickness and mid-arm circumference. Journal of health, population, and nutrition. 2010;28(3):221-9. Epub 2010/07/20.
- Sloan AW: Estimation of body fat in young men. J Appl. Physiol. 1967: 23; 311
- Wells JCK, Fuller NJ, Dewit O, Fewtrell MS, Elia M, Cole T. Four-component model of body composition in children: density and hydration of fat-free mass and comparison with simpler model. Am J Clin Nutr 1999: 69(5); 904
- Wells JCK, Fewtrell MS; Measuring body composition Arch Dis Child 2006: 91; 612
- Widen EM, Gallagher D: Body composition changes in pregnancy: measurement, predictors and outcomes Eur J Clin Nutr 2014: 68; 643
- Yeong Lee S, Gallagher D: Assessment methods in human body composition Curr Opin Clin Nutr Metab Care 2008: 11; 566

- The Toolkit
- About
- What's new
- Other resources
- Toolkit Team
- Contact
- Links to other toolkits
- Nutritools
- NCI/NIH Dietary Assessment Primer
- © 2026 MRC Epidemiology Unit
- Privacy policy and cookies
- Terms of Use