- Nutrients, foods, and diets
- Dietary adequacy and nutritional requirements
- Diet variation, quantification, and misreporting
- Food composition data and databases
- Data processing
- Introduction to subjective measures
- Estimated food diaries
- Weighed food diaries
- 24-hour dietary recalls
- Food frequency questionnaires
- Diet checklists
- Diet histories
- Technology-assisted dietary assessment
Dietary adequacy and nutritional requirements
Dietary adequacy has traditionally been considered in terms of nutrient adequacy, but the scientific community now acknowledges the importance of foods and overall dietary patterns [1]. Thus this section presents an overall (brief) framework of nutritional requirements (i.e. focusing first on nutrient adequacy), and then moves to broader diet considerations in terms of foods and dietary patterns. The latter approach consists of a brief summary of various food-based approaches on dietary adequacy in terms of food, such as food-based guidelines (e.g. Public Health England’s Eatwell Guide), public health messages and campaigns (e.g. 5 A DAY in countries such as the UK, the United States, and Germany), and visual messages (e.g. food pyramids).
The amount of each nutrient needed in the human body is called the nutritional requirement. These are different for each nutrient and also vary between individuals and life stages [2].
Each nutrient has a particular series of functions in the body and some nutrients are needed in larger or smaller quantities than others. Individual requirements of each nutrient are related to a person’s characteristics such as age, gender, level of physical activity and state of health. Also, some people absorb or utilise nutrients less efficiently than others and so may have higher than average nutritional requirements [2].
Values of the nutritional requirements have been based on evidence from clinical and/or population-based research. Strengths of evidence vary by nutrients and by what to consider as required levels or toxic levels. For example, evidence for the required amount of vitamin A is strong on the basis of intervention studies conducted worldwide over decades. By contrast, evidence for a toxic level of vitamin A is relatively weak on the basis of biological knowledge and observational evidence among a limited number of epidemiological studies.
The concept of nutritional requirements at a population level goes back several centuries, but probably the first true standard was published in the UK to prevent starvation among the unemployed population during the economic depression of 1862. Over the following 50 years, further recommendations were published by various international organisations, resulting in the availability of food-based dietary guidelines (FBDG) in 90 nations across the world [3].
Over time, the aims of the recommendations developed from preventing starvation to maintaining and improving the health of the population, taking into account not only the need to avoid deficiency but also the need to reduce the risk of noncommunicable diseases. In the UK, the Recommended Dietary Allowance (RDA) was introduced in 1941 to guide the planning of adequate nutrition for civilians [4, 5]. The RDA was defined as “an average amount of the nutrient, which should be provided per head of a group of people if the needs of practically all members of the group are to be met” [4,5]. Since then, there have been many different approaches to the derivation and terminology of nutritional guidelines, with differences between organisations and jurisdictions. This has caused considerable confusion and the use of guidelines for purposes for which they are not intended. These nutritional guidelines are not policy recommendations per se [3]. In recent years, the use of the term “recommendation” has been widely discontinued to avoid misunderstandings about derivation and usage [5]. Instead, the terms “reference value” or “reference intake” are now favoured.
Examples of nutritional requirements: UK
In the UK there is a set of Dietary Reference Values (DRVs), which are presented in section 7 below. Four types of DRVs were set by the Committee on Medical Aspects of Food and Nutrition Policy (COMA) in 1991. The DRVs comprise a series of estimates of the amount of energy and nutrients needed at a population level (i.e. by groups of healthy people) and are not recommendations or goals for individuals [2]. The DRVs are summarised in Figure D.2.1 and defined as the following:
Estimated Average Requirement (EAR): This is an estimate of the average requirement for energy or a nutrient - approximately 50% of a group of people will require less, and 50% will require more. For a group of people receiving adequate amounts, the range of intakes will vary around the EAR. The EAR is used in particular for energy intake [2,].
Reference Nutrient Intake (RNI): The RNI is the amount of protein, vitamins and minerals that is enough to ensure that the needs of most of the group (97.5%) are being met. They are not minimum targets. By definition, many within the group will need less [2].
Lower Reference Nutrient Intake (LRNI): The amount of a nutrient that is enough for only the small number of people who have low requirements (2.5%). The majority need more. Intakes below the LRNI are almost certainly not enough for most people [2].
Safe intake: This is used where there is insufficient evidence to set an EAR, RNI or LRNI. The safe intake is the amount judged to be a level or range of intake at which there is no risk of deficiency and is below the level where there is a risk of undesirable effects. There is no evidence that intakes above this level have any benefits - and in some instances, they could have toxic effects [2].
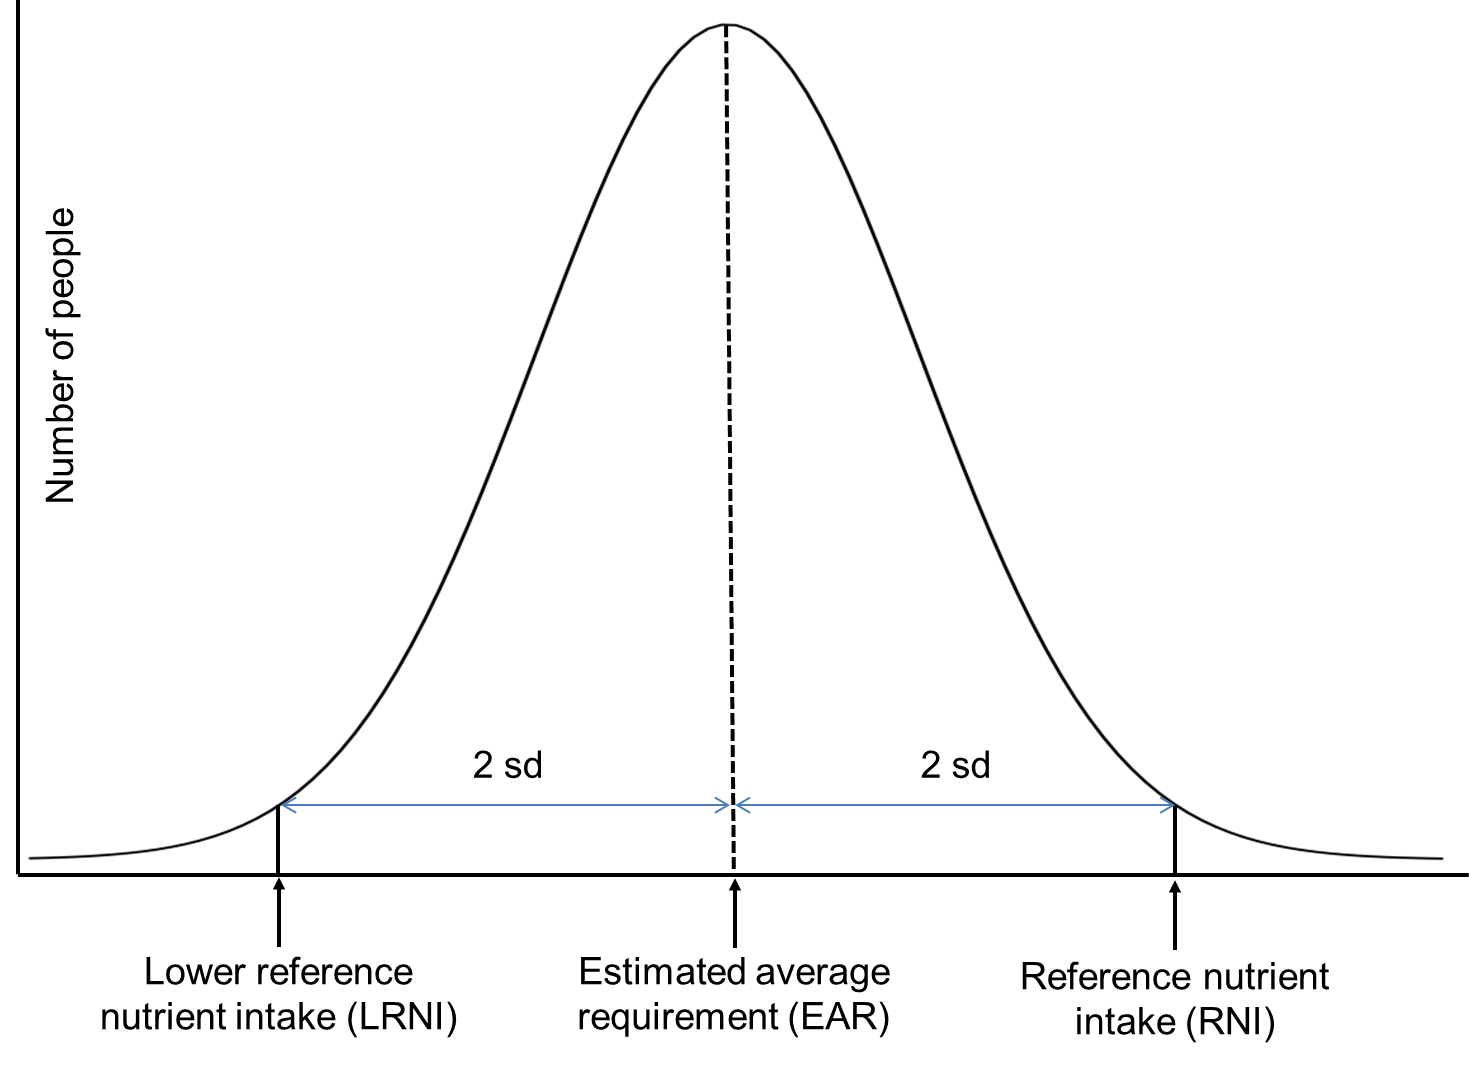
Figure D.2.1 Dietary reference values definitions. The distribution represents the amount of nutrients required, not consumed, to maintain human health. The RNI and LRNI are set at 2 standard deviations (sd) from the mean. Adapted from: [4]
Note this classification has been adopted with different terminology, but there are similar or identical definitions, in many countries.
The European Food Safety Authority (EFSA) sets DRVs for the intake of nutrients and provides this advice to relevant authorities in European countries who use it for making recommendations to consumers [
In the United States, DRVs are referred to as Dietary Reference Intakes (DRI); and RNI, as Recommended Dietary Allowance (RDA). The United States also defines Adequate Intake (AI) established when evidence is insufficient to develop an RDA and is set at a level assumed to ensure nutritional adequacy [7], and the Tolerable Upper Intake Level as maximum daily intake unlikely to cause adverse health effects [7]. Find more here on DRI Tables.
There are two types of dietary adequacy: one is related to physiological requirements which consist of the recommended daily intake of nutrients as explained above [8]. The second approach is the use of the nutrient density concept (e.g. X g of fibre / 1000 kcal) applied to the total diet which can better address issues of "optimal" nutrient intakes to develop nutrition education programmes and evaluate dietary guidelines [1].
In 1995, the Food and Agriculture Organization of the United Nations (FAO) and World Health Organization (WHO) jointly organized an Expert Consultation on the development and use of food-based dietary guidelines which led to the preparation of regional guidelines taking into consideration various factors such as public health concerns, food availability, tradition and culture. To date, many countries have developed national guidelines in the light of the national, traditional food and eating patterns partly depending on the national food production and availability [9].
Some countries/organisations may also consider food sustainability when developing dietary guidelines to help reduce the environmental impact of food production and consumption. Such recommendations include increased consumption of plant foods and a focus on local foods and consumption of fish from sustainable stocks only [10].
Food-based guidelines
Food-based dietary guidelines translate nutritional recommendations into messages about foods [11]. Many countries translate the complexities of dietary reference values and food-based recommendations into visual messages through the use of national food models such as a pyramid or plate [12].
The Eatwell Guide
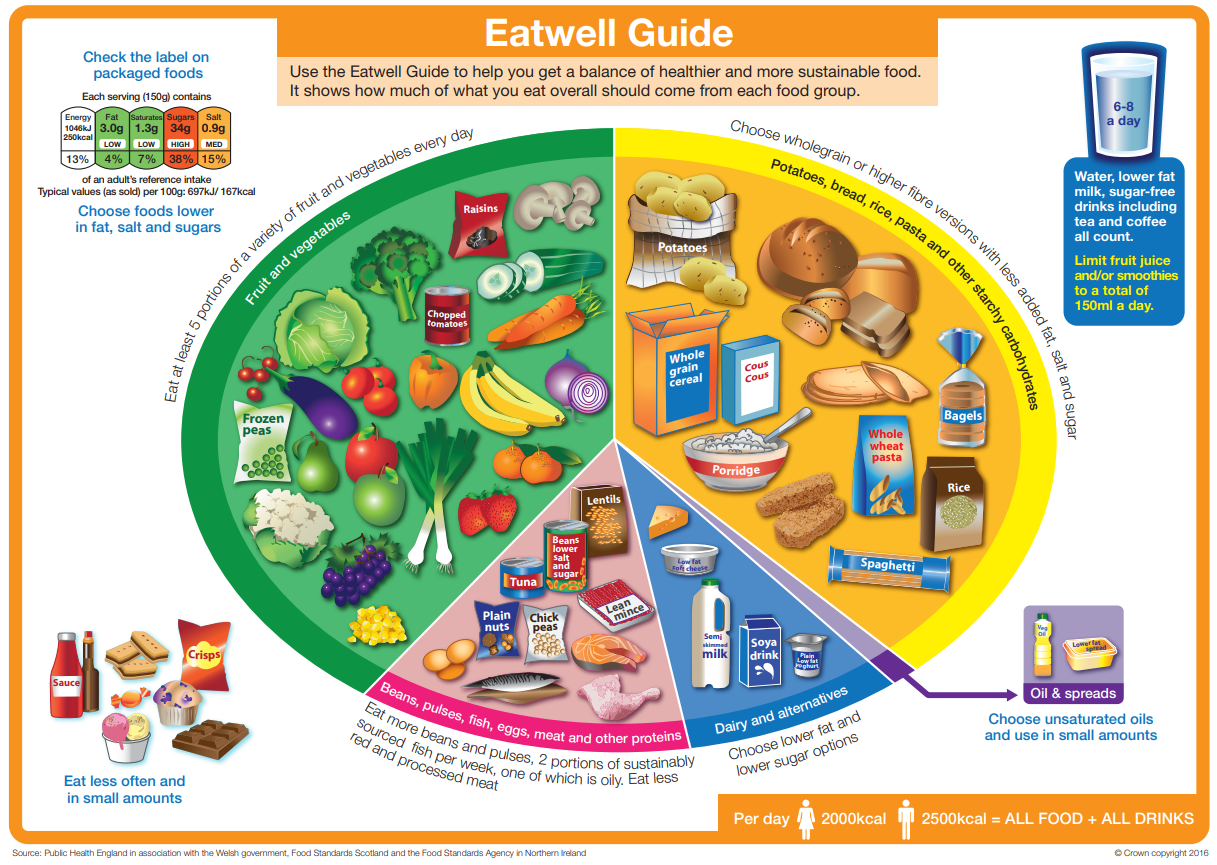
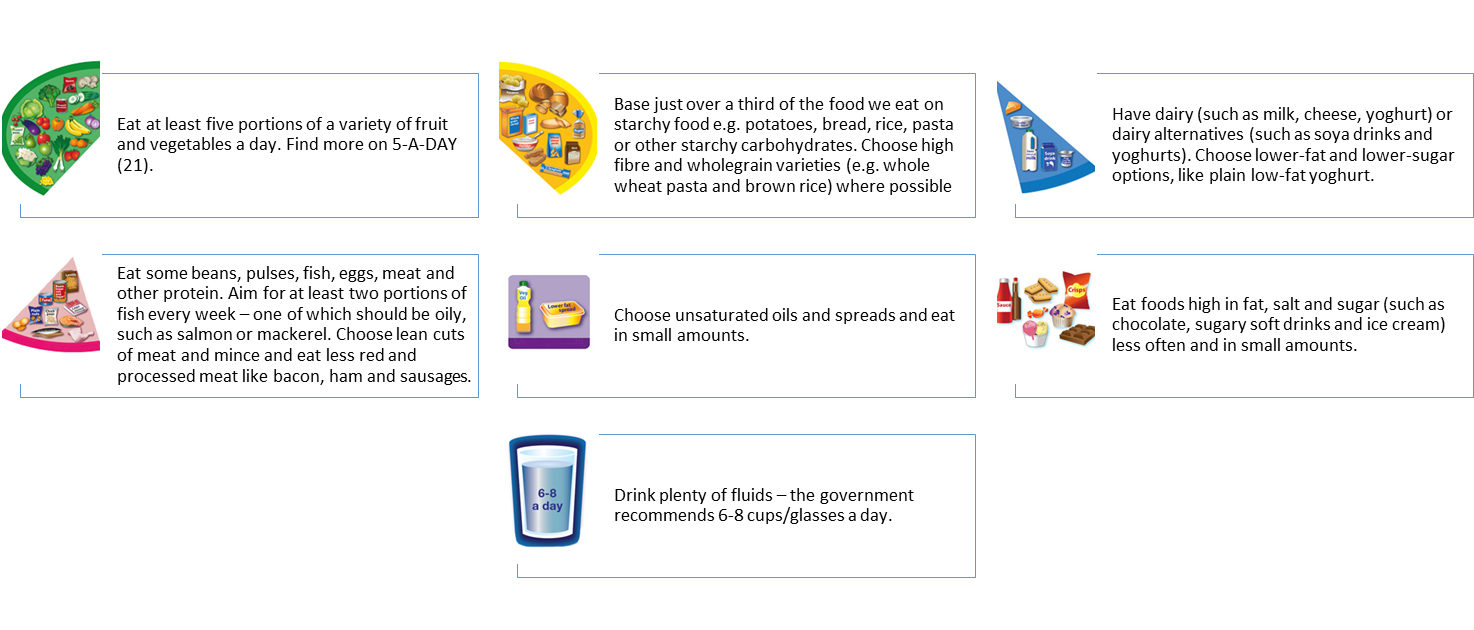
The Eatwell Guide is the UK's healthy eating tool for the general population. It is a practical tool to help people to make healthy choices about the foods and drinks by showing how much of what people eat overall should come from each food group to achieve a healthy, balanced diet. The Eatwell Guide [13] (see Figures D.2.2 and D.2.3) was launched in March 2016 and replaced the former Eatwell Plate [12].
Figure D.2.2 The UK Eatwell Guide. Source: [12]. Download the Eatwell Guide as a PDF (2.41 Mb).
Figure D.2.3 Recommendations of the UK Eatwell Guide (enlarge). Source: [13].
5-A-Day
5-A-Day is a form of national public health campaign in the UK, the United States, and other countries to encourage the consumption of at least five portions of fruit and vegetables each day, following a recommendation of the World Health Organization that individuals “consume a minimum of 400 g of fruit and vegetables per day (excluding potatoes and other starchy tubers)” for the prevention of chronic diseases, as well as for the prevention and alleviation of several micronutrient deficiencies [14].
In the UK, the 5-A-Day program (Figure D.2.4) was introduced by the UK Department of Health to increase fruit and vegetable consumption [10]. The School Fruit and Vegetable Scheme is also part of the 5 A DAY programme to help children to achieve the 5 A DAY goal.

Figure D.2.4 The UK 5-A-DAY logo.
Source: [15].
Fruits & Veggies-More Matters
In the USA, the 5-A-Day campaign has been replaced by Fruits & Veggies-More Matters® (Figure D.2.5), which is a health initiative aiming to increase the intake of fruit and vegetables.

Figure D.2.5 Fruits & veggies-More Matters logo used in the United States
Source: Fruits & Veggies-More Matters®.
Examples of Food Pyramids
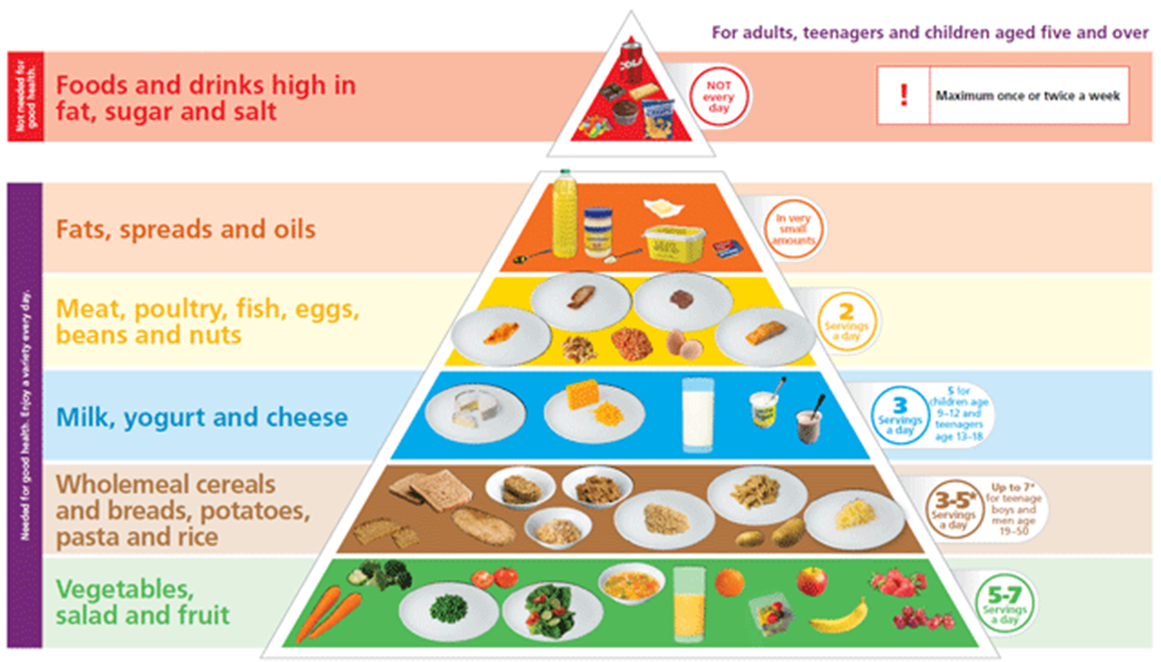
Figures D.2.6 and D.2.7 display food pyramids from the Republic of Ireland and Switzerland respectively. As a typical example of food pyramids, each pyramid has six groups, each forming a layer. The base layer, across the widest part of the pyramid, is for the food group we should eat the greatest quantities of, i.e. ‘vegetables, salad, fruit’, and the narrow top depicts the group we should eat least of, i.e. ‘sugary foods, drinks and crisps’. Find more here on the Irish Food Pyramid and Swiss Food Pyramid.
Figure D.2.6 The Irish Food Pyramid (enlarge).
Source: Safefood.eu
Figure D.2.7 The Swiss Food Pyramid (enlarge).
Source: https://www.sge-ssn.ch/media/sge_pyramid_E_basic_20161.pdf
Other food-based guidelines
MyPlate
Over the past decades, the United States Department of Agriculture (USDA) created several guidelines to assist the public in making healthful food choices. In 2011, the Food Guide Pyramid and MyPyramid were replaced with MyPlate – a simple and practical guideline for making healthful food choices as shown in Figure D.12.8. Find more on MyPlate.
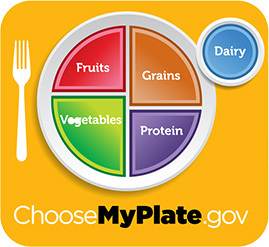
Figure D.2.8 MyPlate symbol illustrates the five food groups that are the building blocks for a healthy diet using a familiar image – a place setting for a meal.
Source:https://www.myplate.gov/
The following sections provide information on UK dietary reference values.
Macronutrients - Energy, fat, carbohydrates and protein
Table D.2.1 Estimated Average Requirements for energy (per day) across age groups.
| |
Men | Women | ||
| Energy intake per day | MJ | kcal | MJ | kcal |
| Age | |
|
|
|
| Infants | |
|
|
|
| Breastfed | |
|
|
|
| 1-2 months | 2.2 | 526 | 2.0 | 478 |
| 3-4 months | 2.4 | 574 | 2.2 | 526 |
| 5-6 months | 2.5 | 598 | 2.3 | 550 |
| 7-12 months | 2.9 | 694 | 2.7 | 646 |
| Formula-fed | ||||
| 1-2 months | 2.5 | 598 | 2.3 | 550 |
| 3-4 months | 2.6 | 622 | 2.5 | 598 |
| 5-6 months | 2.7 | 646 | 2.6 | 622 |
| 7-12 months | 3.1 | 742 | 2.8 | 670 |
| Mixed feeding or unknown | |
|
|
|
| 1-2 months | 2.4 | 574 | 2.1 | 502 |
| 3-4 months | 2.5 | 598 | 2.3 | 550 |
| 5-6 months | 2.6 | 622 | 2.4 | 574 |
| 7-12 months | 3.0 | 718 | 2.7 | 646 |
| 1 year | 3.2 | 765 | 3.0 | 717 |
| 2 years | 4.2 | 1004 | 3.9 | 932 |
| 3 years | 4.9 | 1171 | 4.5 | 1076 |
| Children | |
|
|
|
| 4 years | 5.8 | 1386 | 5.4 | 1291 |
| 5 years | 6.2 | 1482 | 5.7 | 1362 |
| 6 years | 6.6 | 1577 | 6.2 | 1482 |
| 7 years | 6.9 | 1649 | 6.4 | 1530 |
| 8 years | 7.3 | 1745 | 6.8 | 1625 |
| 9 years | 7.7 | 1840 | 7.2 | 1721 |
| 10 years | 8.5 | 2032 | 8.1 | 1936 |
| 11 years | 8.9 | 2127 | 8.5 | 2032 |
| 12 years | 9.4 | 2247 | 8.8 | 2103 |
| 13 years | 10.1 | 2414 | 9.3 | 2223 |
| 14 years | 11.0 | 2629 | 9.8 | 2342 |
| 15 years | 11.8 | 2820 | 10.0 | 2390 |
| 16 years | 12.4 | 2964 | 10.1 | 2414 |
| 17 years | 12.9 | 3083 | 10.3 | 2462 |
| 18 years | 13.2 | 3155 | 10.3 | 2462 |
| Adults* | |
|
|
|
| 19-24 | 11.6 | 2772 | 9.1 | 2175 |
| 25-34 | 11.5 | 2749 | 9.1 | 2175 |
| 35-44 | 11.0 | 2629 | 8.8 | 2103 |
| 45-54 | 10.8 | 2581 | 8.8 | 2103 |
| 55-64 | 10.8 | 2581 | 8.7 | 2079 |
| 65-74 | 9.8 | 2342 | 7.7 | 1912 |
| 75+ | 9.6 | 2294 | 8.7 | 1840 |
| Pregnancy (last 3 months only) | |
|
+0.8 | +200 |
| Lactation | |
|
|
|
| 0-6 months | |
|
1.38 | 330 |
| 6+ months | |
|
** | ** |
*Requirements are based on the average daily energy required for people of a healthy weight who are moderately active.
** The energy intake required to support breastfeeding will be modified by maternal body composition and the breast milk intake
of the infant.
Source: [16].
Carbohydrate and Fat
Table D.2.2 Carbohydrate and fat as a percentage of energy intake.
| |
% Daily Food Energy |
| Total Carbohydrate* | 50% |
| of which Free Sugars** | Not more than 5% |
| Total Fat*** |
Not more than 35% |
| of which Saturated Fat*** | Not more than 11% |
*SACN 2015 recommendations for population aged 2 years and above [17].
** Free sugars definition comprises all monosaccharides and disaccharides added to foods by the manufacturer, cook or consumer, plus sugars naturally present in honey, syrups and unsweetened fruit juices. Under this definition, lactose naturally
present in milk and milk products and sugars contained within the cellular structure of foods would be excluded. SACN recommended the definition for ‘free sugars’ be adopted in the UK [16].
***COMA 1991 recommendations for the population aged 5 years and above [18].
Dietary fibre
Table D.2.3 Recommended intake of AOAC fibre by age group.
| Age group | Recommended intake per day (g)* |
| 2-5 years | 15 |
| 5-11 years | 20 |
| 11-16 years | 25 |
| 17 years and over | 30 |
*SACN 2015 dietary fibre recommendations for the population aged 2 years and above, of which dietary fibre intake is measured using the AOAC methods agreed by regulatory authorities. Note: The previous dietary reference value of 18g/day of non-starch polysaccharides, defined by the Englyst method, equates to about 23-24 g/day of dietary fibre, if analysed using the AOAC methods, thus the new recommendation represents an increase from this current value [17].
Salt
Table D.2.4 Recommended intake of salt by age group.
| Age group | Maximum intake per day (g*)** |
| Adults (≥16 years of age) | 5 |
| Children ( 2–15 years of age) | The recommended maximum level of intake of 2 g/day sodium in adults should be adjusted downward based on the energy requirements of children relative to those of adults |
*Achievable population goals. **1g salt (sodium chloride, NaCl) contains 393.4mg sodium.
Source: WHO, 2012 [19].
Find more on salt reduction programmes in the UK here:
Consensus Action on Salt and Health (CASH).
Protein
Table D.2.5 Reference Nutrient Intake of protein by age group.
| Age group | Protein, g/d* |
| 0-3 months | 12.5 |
| 4-6 months | 12.7 |
| 7-9 months | 13.7 |
| 10-12 months | 14.9 |
| 1-3 years | 14.5 |
| 4-6 years | 19.7 |
| 7-10 years | 28.3 |
| |
|
| Males | |
| 11-14 years | 42.1 |
| 15-18 years | 55.2 |
| 19-50 years | 55.5 |
| 50+ years | 53.3 |
| |
|
| Females | |
| 11-14 years | 41.2 |
| 15-18 years | 45.0 |
| 19-50 years | 45.0 |
| 50+ years | 46.5 |
| |
|
| Pregnancy | +6 |
| |
|
| Lactation | |
| 0-4 months | +11 |
| 4+ months | +8 |
*The UK values for all adults are based on daily 0.75g of protein per kg body weight (e.g. an adult weighing 60g, will need 60 x 0.75g/d= 45g protein a day). Values for children, women during pregnancy and women during lactation are set at a higher value per kg body weight
to reflect the extra protein requirement.
Source: COMA 1991 [18].
Alcohol
- Alcohol should provide no more than 5% of energy in the diet which applies to adults only [18].
- In pregnant women or women planning a pregnancy, the safest approach is not to drink alcohol at all [20].
- The UK Chief Medical Officers’ (CMOs) alcohol guidelines give advice to the public on the risks of alcohol consumption [20].
Vitamins
Table D.2.6 Reference Nutrient Intake for Vitamins.
| Age | Thiamin | Riboflavin | Niacin | Vitamin B6 | Vitamin B12 | Folate | Vitamin C | Vitamin A | Vitamin D |
| |
mg/d | mg/d | mg/d | mg/d | μg/d | μg/d | mg/d | μg/d | μg/d (IU/d) |
| 0-3 months | 0.2 | 0.4 | 3 | 0.2 | 0.3 | 50 | 25 | 350 | 8.5-10** |
| 4-6 months | 0.2 | 0.4 | 3 | 0.2 | 0.3 | 50 | 25 | 350 | 8.5-10** |
| 7-9 months | 0.2 | 0.4 | 4 | 0.3 | 0.4 | 50 | 25 | 350 | 8.5-10** |
| 10-12 months | 0.3 | 0.4 | 5 | 0.4 | 0.4 | 50 | 25 | 350 | 8.5-10** |
| 1-3 years | 0.5 | 0.6 | 8 | 0.7 | 0.5 | 70 | 30 | 400 | 10 |
| 4-6 years | 0.7 | 0.8 | 11 | 0.9 | 0.8 | 100 | 30 | 400 | 10 |
| 7-10 years | 0.7 | 1.0 | 12 | 1.0 | 1.0 | 150 | 30 | 500 | 10 |
| |
|
|
|
|
|
|
|
|
|
| Males | |
|
|
|
|
|
|
|
|
| 11-14 years | 0.9 | 1.2 | 15 | 1.2 | 1.2 | 200 | 35 | 600 | 10 |
| 15-18 years | 1.1 | 1.3 | 18 | 1.5 | 1.5 | 200 | 40 | 700 | 10 |
| 19-50 years | 1.0 | 1.3 | 17 | 1.4 | 1.5 | 200 | 40 | 700 | 10 |
| 50+ years | 0.9 | 1.3 | 16 | 1.4 | 1.5 | 200 | 40 | 700 | 10 |
| |
|
|
|
|
|
|
|
|
|
| Females | |
|
|
|
|
|
|
|
|
| 11-14 years | 0.7 | 1.1 | 12 | 1.0 | 1.2 | 200 | 35 | 600 | 10 |
| 15-18 years | 0.8 | 1.1 | 14 | 1.2 | 1.5 | 200 | 40 | 600 | 10 |
| 19-50 years | 0.8 | 1.1 | 13 | 1.2 | 1.5 | 200 | 40 | 600 | 10 |
| 50+ years | 0.8 | 1.1 | 12 | 1.2 | 1.5 | 200 | 40 | 600 | 10 |
| |
|
|
|
|
|
|
|
|
|
| Pregnancy | +0.1 | +0.3 | - | - | - | +100 | +10** | +100 | 10 |
| |
|
|
|
|
|
|
|
|
|
| Lactation | |
|
|
|
|
|
|
|
|
| 0-4 months | +0.2 | +0.5 | +2 | - | +0.5 | +60 | +30 | +350 | 10 |
| 4+ months | +0.2 | +0.5 | +2 | - | +0.5 | +60 | +30 | +350 | 10 |
-No increase, *For last trimester only, **Safe intake. 8.5-10 μg/d is equivalent to 340-400 IU vitamin D. 10 μg/d is equal to 400 IU vitamin D.
Source: COMA 1991 [5] for all vitamins except vitamin D. New recommendation on Vitamin D was set by SACN in 2016 [21].
Find more on Folate intake in the UK: SACN, Folate and Disease Prevention. London 2006.
Vitamin E
The vitamin E requirement widely differs based on the polyunsaturated fatty acid (PUFA) intake. Thus, COMA decided that it was impossible to set DRVs of practical value. COMA considered the ranges of α-tocopherol equivalent/day intake calculated from the National Diet and Nutrition Survey [22] and concluded that daily intakes of 4 mg and 3 mg of α- tocopherol equivalents could be adequate for men and women respectively [18]. Intakes of 3.8 – 6.2 mg/day were considered to be satisfactory for pregnant and lactating women [18].
Minerals
Table D.2.7 Reference Nutrient Intake for Minerals.
| Age | Calcium | Phosphorus | Magnesium | Sodium | Potassium | Chloride | Iron | Zinc | Copper | Selenium | Iodine |
| |
mg/d | mg/d | mg/d | mg/d | mg/d | mg/d | mg/d | mg/d | mg/d | μg/d | μg/d |
| 0-3 months | 525 | 400 | 55 | 210 | 800 | 320 | 1.7 | 4.0 | 0.2 | 10 | 50 |
| 4-6 months | 525 | 400 | 60 | 280 | 850 | 400 | 4.3 | 4.0 | 0.3 | 13 | 60 |
| 7-9 months | 525 | 400 | 75 | 320 | 700 | 500 | 7.8 | 5.0 | 0.3 | 10 | 60 |
| 10-12 months | 525 | 400 | 80 | 350 | 700 | 500 | 7.8 | 5.0 | 0.3 | 10 | 60 |
| 1-3 years | 350 | 270 | 85 | 500 | 800 | 800 | 6.9 | 5.0 | 0.4 | 15 | 70 |
| 4-6 years | 450 | 350 | 120 | 700 | 1100 | 1100 | 6.1 | 6.5 | 0.6 | 20 | 100 |
| 7-10 years | 550 | 450 | 200 | 1200 | 2000 | 1800 | 8.7 | 7.0 | 0.7 | 30 | 110 |
| |
|
|
|
|
|
|
|
|
|
|
|
| Males | |
|
|
|
|
|
|
|
|
|
|
| 11-14 years | 1000 | 775 | 280 | 1600 | 3100 | 2500 | 11.3 | 9.0 | 0.8 | 45> | 130 |
| 15-18 years | 1000 | 775 | 300 | 1600 | 3500 | 2500 | 11.3 | 9.5 | 1.0 | 70 | 140 |
| 19-50 years | 700 | 550 | 300 | 1600 | 3500 | 2500 | 87 | 9.5 | 1.2 | 75 | 140 |
| 50+ years | 700 | 550 | 300 | 1600 | 3500 | 2500 | 8.7 | 9.5 | 1.2 | 75 | 140 |
| |
|
|
|
|
|
|
|
|
|
|
|
| Females | |
|
|
|
|
|
|
|
|
|
|
| 11-14 years | 800 | 625 | 280 | 1600 | 3100 | 2500 | 14.8 | 9.0 | 0.8 | 45 | 130 |
| 15-18 years | 800 | 625 | 300 | 1600 | 3500 | 2500 | 14.8 | 7.0 | 1.0 | 60 | 140 |
| 19-50 years | 700 | 550 | 270 | 1600 | 3500 | 2500 | 14.8 | 7.0 | 1.2 | 6.0 | 140 |
| 50+ years | 700 | 550 | 270 | 1600 | 3500 | 2500 | 8.7 | 7.0 | 1.2 | 60 | 140 |
| |
|
|
|
|
|
|
|
|
|
|
|
| Pregnancy | * | * | * | * | * | * | * | * | * | * | * |
| |
|
|
|
|
|
|
|
|
|
|
|
| Lactation | |
|
|
|
|
|
|
|
|
||
| 0-4 months | +550 | +440 | +50 | * | * | * | * | +6.0 | +0.3 | +15 | * |
| 4+ months | +550 | +440 | +50 | * | * | * | * | +2.5 | +0.3 | +15 | * |
*No increase, **Insufficient for women with high menstrual losses where the most practical way of meeting iron requirements is to take iron supplements.
Source: COMA 1991 [18].
Find more on Calcium, Iron and Iodine intake in the UK:
Several supplements are used in a clinical setting after a formal diagnosis of a medical condition, including, for instance, iron supplements for iron deficiency anaemia. For the general population, dietary supplements have not been recommended. Several exceptions exist for specific population segments. The following are examples of vitamin D and folic acid.
Vitamin D supplements
In the UK, The Department of Health recommends [23] that:
- Breastfed babies from birth to one year of age should be given a daily supplement containing 8.5 to 10 µg of vitamin D to make sure they get enough.
- Babies fed infant formula should not be given a vitamin D supplement until they are receiving less than 500 ml (about a pint) of infant formula a day, because infant formula is fortified with vitamin D.
- Children aged 1 to 4 years old should be given a daily supplement containing 10 µg of vitamin D [23].
Public Health England (PHE) advised the government in 2016 [24] that:
- Everyone needs vitamin D equivalent to an average daily intake of 10 µg.
- Since it is difficult for people to meet the 10 µg recommendation from consuming foods naturally containing or fortified with vitamin D, people should consider taking a daily supplement containing 10 µg of vitamin D in autumn and winter [24].
In the United States, the fortification of dairy products and breakfast cereals with nutrients including vitamin D is regulated by Food and Drug Administration [25]. Thus, the use of vitamin D supplementation has not been recommended with emphasis. In the UK, food fortification with vitamin D and other nutrients has been debated as well [24].
Folic acid supplements in pregnancy
In the UK and many other countries, all women planning to have a baby are recommended to take a folic acid supplement, as should any pregnant woman up to week 12 of her pregnancy in order to prevent neural tube defects and other fetal malformations [18].
- Verger EO, Le Port A, Borderon A, Bourbon G, Moursi M, Savy M, Mariotti F, Martin-Prevel Y, Dietary Diversity Indicators and Their Associations with Dietary Adequacy and Health Outcomes: A Systematic Scoping Review. Adv Nutr. 2020;12:1659-1672
- British Nutrition Foundation. Nutrient Requirements. 2016. Available from: https://www.nutrition.org.uk/attachments/article/234/Nutrition%20Requirements_Revised%20Oct%202016.pdf
- Herforth A, Arimond M, Álvarez-Sánchez C, Coates J, Christianson K, Muehlhoff E, A Global Review of Food-Based Dietary Guidelines. Advances in nutrition (Bethesda, Md.).2018;10:590-605
- GCE Nutrition & Food Science, Nutrient Requirement. (2016). Retrieved 27 October 2021, from https://ccea.org.uk/downloads/docs/Support/Fact%20File%3A%20AS/2019/AS%201%20Nutrition%20and%20Food%20Science%20Fact%20File%3A%20Nutrient%20Requirements.pdf
- Dietary reference values. (2021). Retrieved 27 October 2021, from https://www.efsa.europa.eu/en/topics/topic/dietary-reference-values
- European Food Safety Authority (EFSA). Dietary Reference Values and Dietary Guidelines. 2016. Available from: https://www.efsa.europa.eu/en/topics/topic/drv
- National Institute of Health. Nutrient Recommendations: Dietary Reference Intakes (DRI). Available from: https://ods.od.nih.gov/Health_Information/Dietary_Reference_Intakes.aspx
- Spiro, A.& Wood, V. (2021) Can the concept of nutrient density be useful in helping consumers make informed and healthier food choices? A mixed-method exploratory approach. Nutrition Bulletin, 46, 354– 372. https://doi.org/10.1111/nbu.12512
- The Food and Agriculture Organization (FAO). Food-based dietary guidelines. (2021). Retrieved 27 October 2021, from https://www.fao.org/nutrition/education/food-dietary-guidelines/home/en/
- Dietary guidelines and sustainability. Available from: http://www.fao.org/nutrition/education/food-dietary-guidelines/background/sustainable-dietary-guidelines/en/
- Dwyer J. Dietary standards and guidelines: Similarities and differences among countries. In: Erdman JW, Macdonald IA, Zeisel SH, editors. Present Knowledge in Nutrition. 10th ed. Ames (IA): Wiley-Blackwell and International Life Sciences Institute; 2012. p. 1110–34.. Chapter 65.
- Public Health England (PHE). From Plate to Guide: What, why and how for the eatwell model. 2016. Available from: https://www.gov.uk/government/uploads/system/uploads/attachment_data/file/579388/eatwell_model_guide_report.pdf
- National Health Service (NHS). The Eatwell Guide. 2016. Available from: http://www.nhs.uk/Livewell/Goodfood/Pages/the-eatwell-guide.aspx
- Rosi A, Scazzina F, Ingrosso L, Morandi A, Del Rio D, Sanna A, The "5 a day" game: a nutritional intervention utilising innovative methodologies with primary school children. International journal of food sciences and nutrition.2015;66:713-7
- National Health Service (NHS). 5-A-Day. 2016. Available from: http://www.nhs.uk/LiveWell/5ADAY/Pages/5ADAYhome.aspx
- Scientific Advisory Committee on Nutrition (SACN). Dietary Reference Values for Energy. 2011. Available from: https://www.gov.uk/government/uploads/system/uploads/attachment_data/file/339317/SACN_Dietary_Reference_Values_for_Energy.pdf
- Scientific Advisory Committee on Nutrition (SACN). Carbohydrates and Health report. 2015. Available from: https://www.gov.uk/government/publications/sacn-carbohydrates-and-health-report
- Department of Health. Dietary Reference Values for Food Energy and Nutrients for the United Kingdom no. 41. 2011. London: HMSO
- WHO. Guideline: Sodium intake for adults and children. Geneva, World Health Organization; 2012 (http://www.who.int/nutrition/publications/guidelines/sodium_intake/en/)
- Department of Health. UK Chief Medical Officers’ Low Risk Drinking Guidelines. 2016. Available from: https://www.gov.uk/government/uploads/system/uploads/attachment_data/file/545937/UK_CMOs__report.pdf
- Scientific Advisory Committee on Nutrition (SACN). Vitamin D and Health report. 2016. Available from: https://www.gov.uk/government/publications/sacn-vitamin-d-and-health-report
- EFSA NDA Panel (EFSA Panel on Dietetic Products, Nutrition and Allergies), 2015. Scientific Opinion on Dietary Reference Values for vitamin E as alpha-tocopherol. EFSA Journal 2015; 13( 7):4149, 72 pp. doi:10.2903/j.efsa.2015.4149
- National Health Service (NHS). Vitamins and Minerals. 2016. Available from: http://www.nhs.uk/Conditions/vitamins-minerals/Pages/Vitamin-D.aspx
- Public Health England (PHE). PHE publishes new advice on vitamin D. 2016. Available from: https://www.gov.uk/government/news/phe-publishes-new-advice-on-vitamin-d
- Dwyer JT, Wiemer KL, Dary O, Keen CL, King JC, Miller KB, Philbert MA, Tarasuk V, Taylor CL, Gaine PC, et al. Fortification and health: challenges and opportunities. Adv Nutr, 2015;6:124-31
